The environmental impact of the web in numbers (2022)
Motivated by environmental concerns, the "Flight shame" movement born in Sweden (Flygskam) refers to the shame of taking the plane because of the pollution generated by this mode of transport.

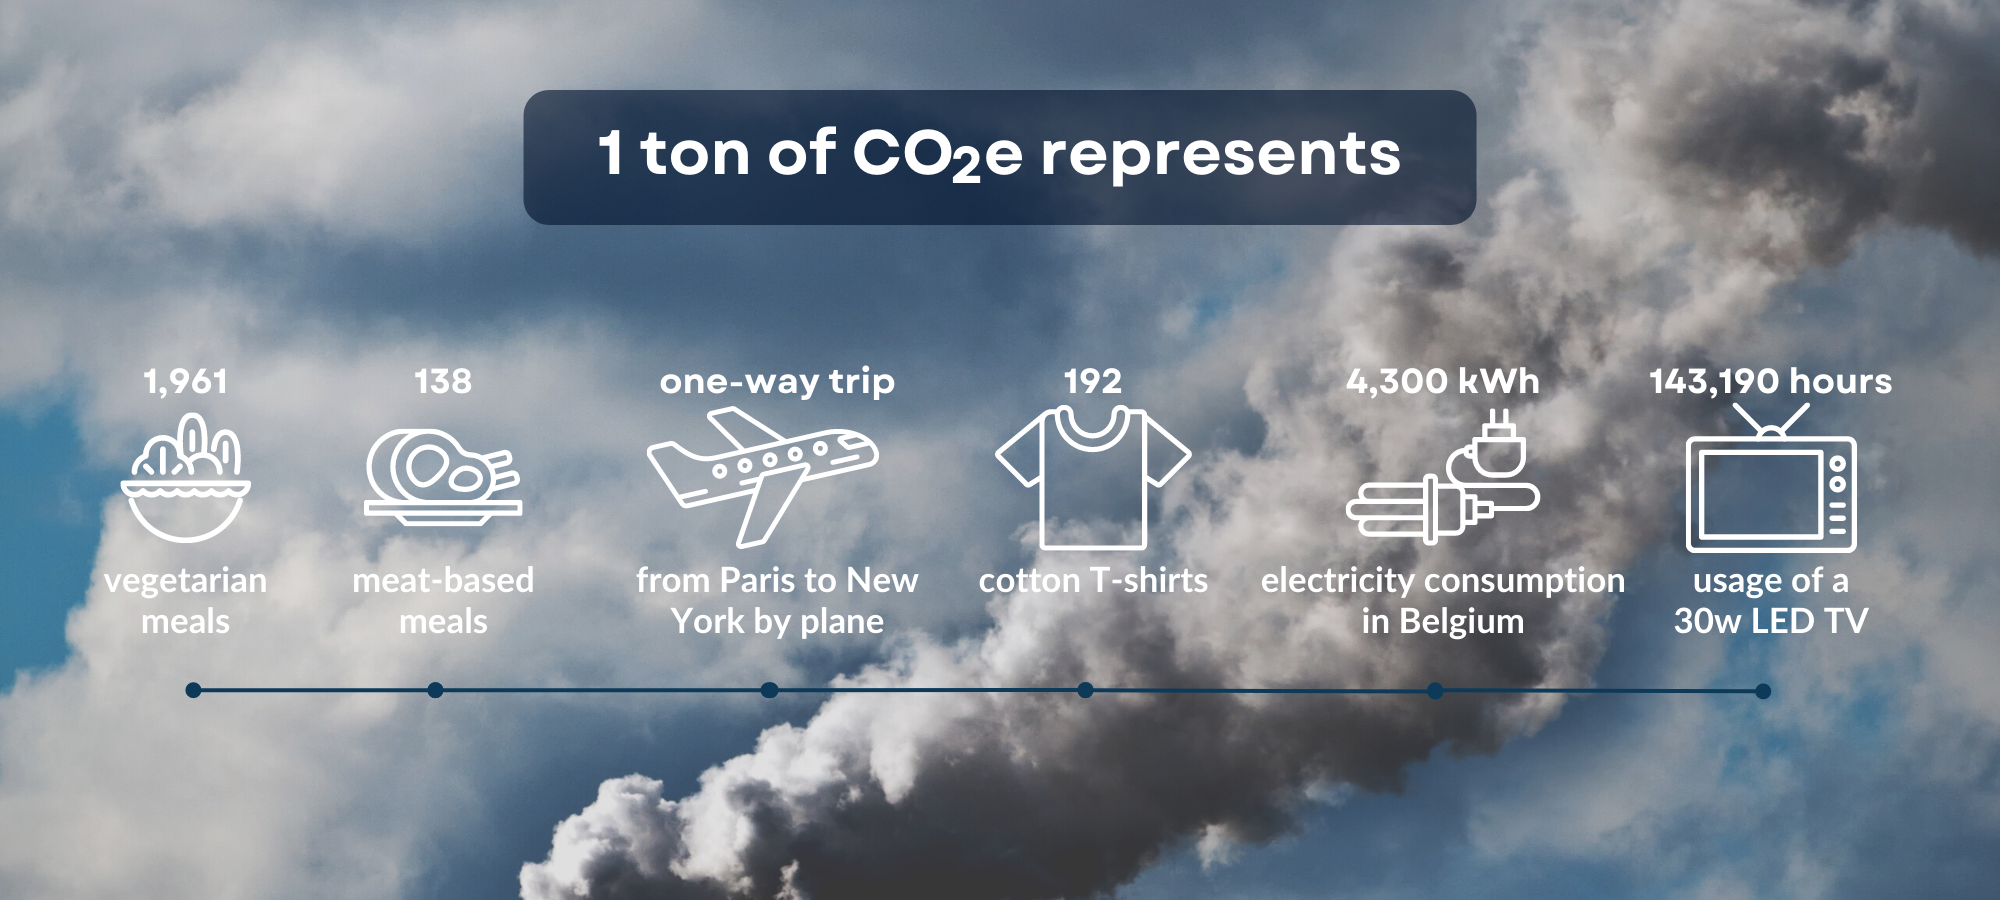
The emission of greenhouse gases produced by the digital sector is 50% more important than air transport, it represents 4% of the greenhouse gas emissions in the world. With such a high balance sheet, we could also see a feeling of guilt emerge when we consume content on the Internet. To get an idea, here are some figures that represent the ecological impact of digital technology in 2022.
Some alarming figures
According to the study conducted in 2019 by GreenIT.fr, the annual global footprint of the web is 1500 million tons of CO2 equivalent and 7.8 billion cubic meters of water.
#1 The weight of web pages
In 10 years, the median weight of web pages has increased by 210% on desktop and 570% on mobile according to httparchive.org. In 1995 a page was on average 14 Kb, in 2022 it is rather 2200 Kb. The main reason is without surprise related to media, images and videos being increasingly heavy.
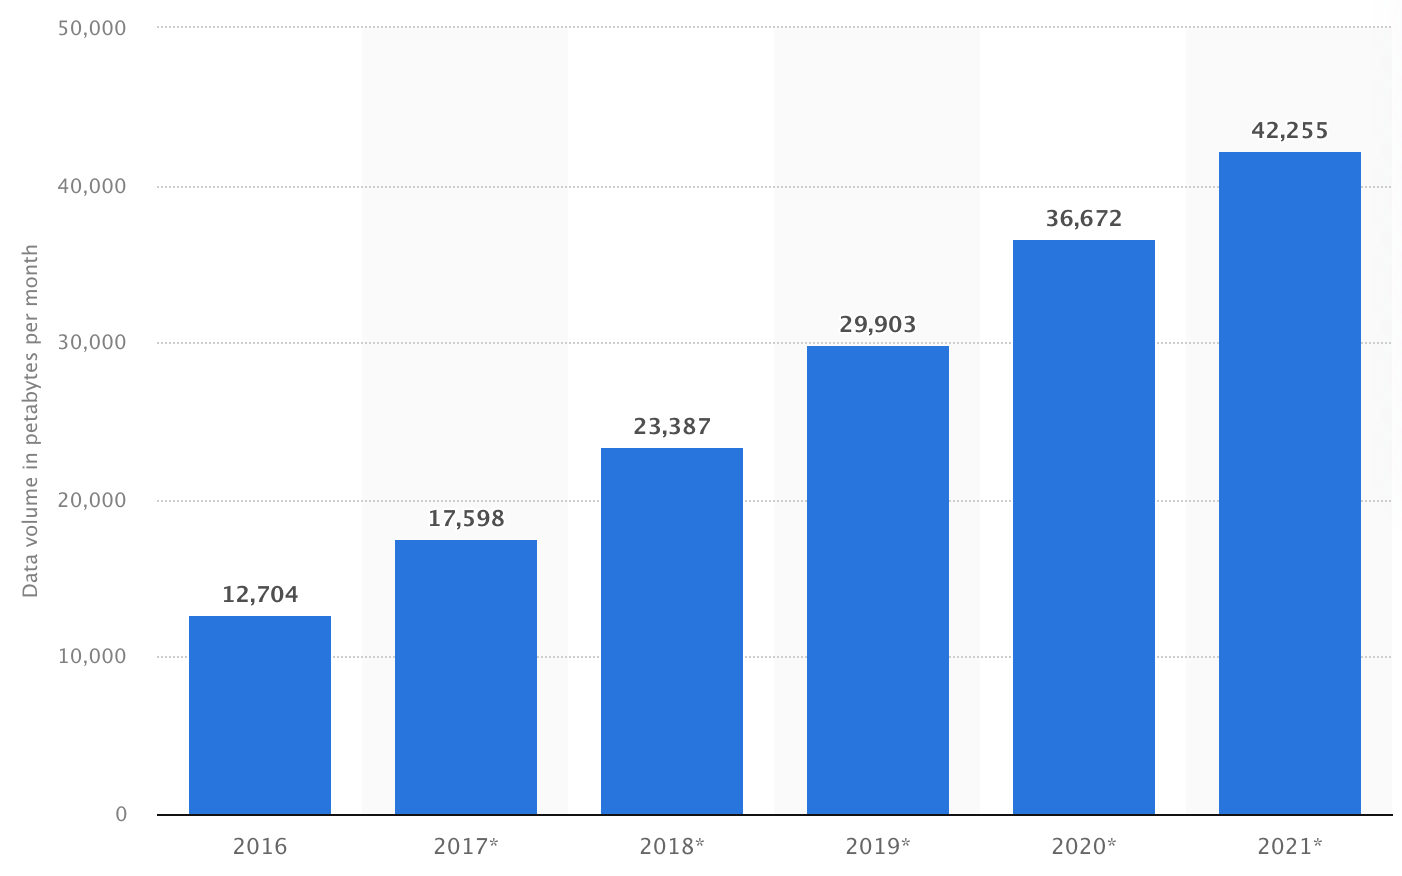
#2 The data volume
There has been an increase in the overall volume of the internet, over 300% in 5 years. With streaming becoming more and more accessible and diverse and video qualities increasing. We're not just reading some content, the video format is gaining traction on the web, which in total weighs heavily on the carbon footprint bill.
#3 The increase in browser consumption
Browser consumption is also constantly growing. A study by Greenspector shows that the average energy consumption, all browsers combined, is 49mAh in 2021, while it was 47mAh in 2020, that is 4.2% more in one year.
.png)
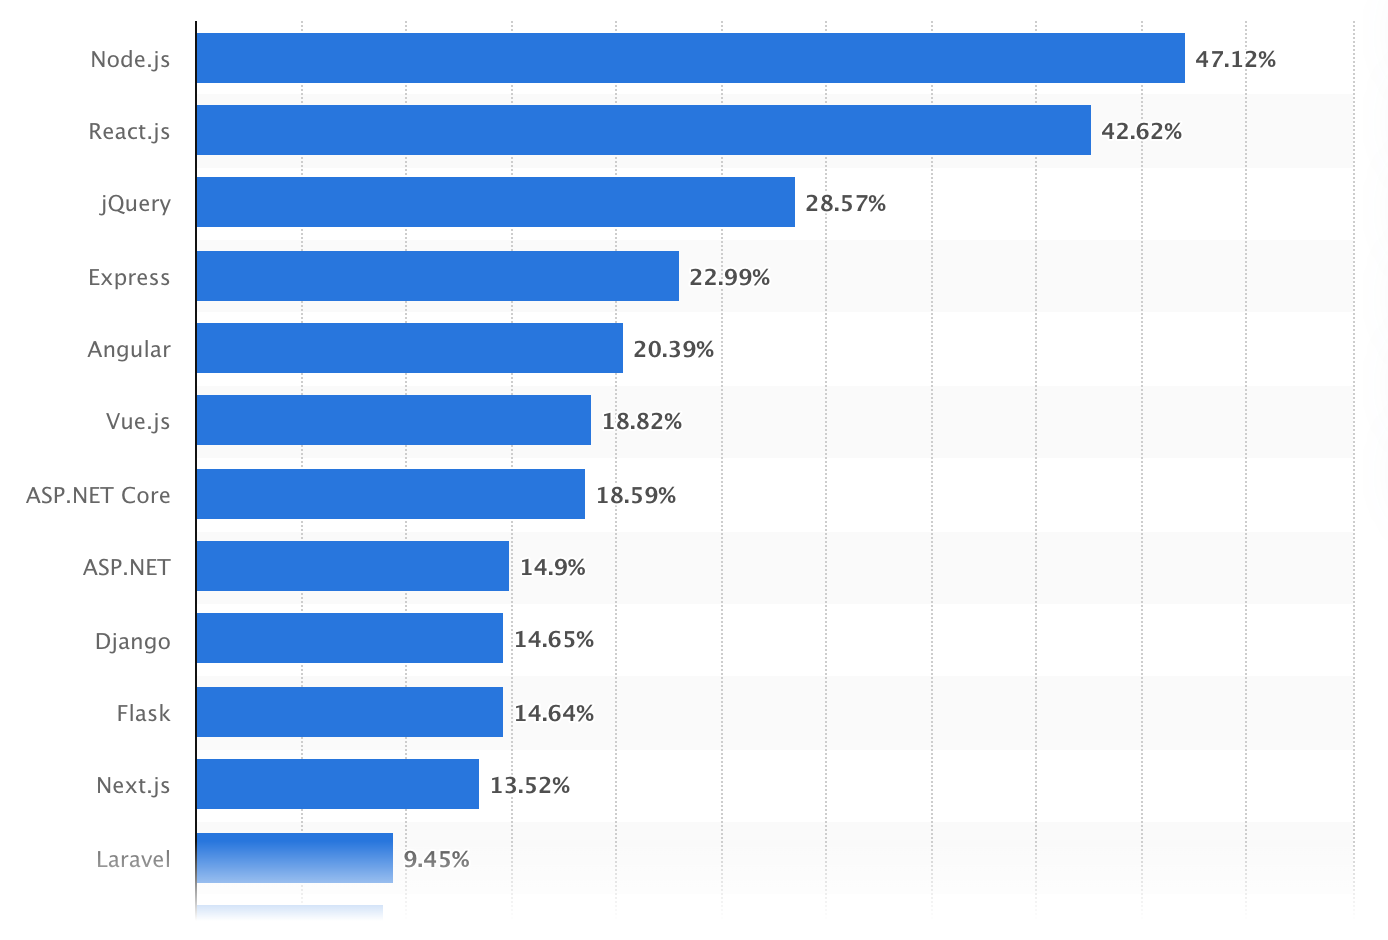
#4 The frameworks
On the programming side, heavy and obsolete tools are still in use and yet are not essential. The annual study provided by Stack Overflow, shows that jQuery is still widely used for web product development. However, it increases the amount of computation to execute the JavaScript code and therefore the energy consumption and the carbon footprint. Simple solutions exist to avoid using it, like the cheat sheet youmightnotneedjquery which leaves a very clear message.
#5 Hosting
The bill is heavy, according to hellocarbo "Data centers are responsible for 0.3% of global greenhouse gas emissions" and "...consume 2% of the world's electricity" in 2022.
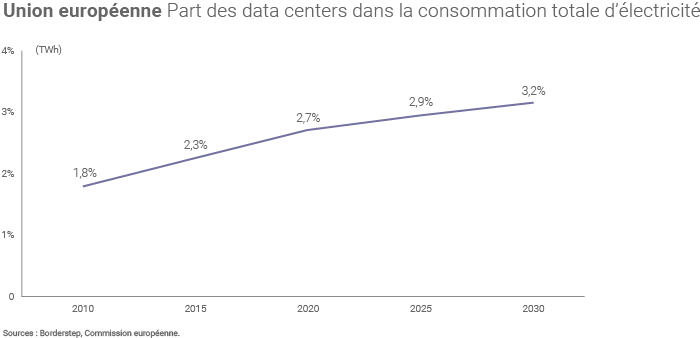
A study commissioned by the European Commission estimates that between 2018 and 2025, there will be a 28% increase in data center energy consumption, from 26.3 to 38.9 TWh/year.
How to measure the ecological impact of your website
With this observation, we can ask ourselves how we can reduce the ecological impact of digital products. The first thing to do is to assess the situation. Many parameters are to be taken into account to eco-design its website and make it more efficient. Some tools allow you to measure the ecological footprint of your website and to have a precise idea of how to improve it.
Ecology ≠ Performance - Just because a website is fast doesn't mean it's green. An eco-designed website is not necessarily more efficient.
#1 Tools to measure the energy consumption of your website
One of the most important parameters in eco-design is hosting. Note that a green host, is a host that takes certain actions to limit the ecological impact that its data centers generate. Some of these best practices are the use of more efficient cooling systems, the construction of data centers in cold climate regions, the reuse of heat, especially for district heating or even the use of renewable energy. Here are some tools that can help you evaluate your website's consumption.
- https://www.thegreenwebfoundation.org - This includes the type of energy that the provider uses to power its data center. The Green Web Foundation allows you to know in a simple and binary way, if the hosting company you are using for the domain you are measuring is green or not. To go further, Electricity Maps provides information on the type of energy produced by country, to help in the choice of hosting.
- http://www.ecoindex.fr - By combining 3 parameters: the number of DOM elements, the weight in KB of the transferred data (download) and the number of HTTP requests, a score out of 100 is attributed and is called EcoIndex. The Responsible Digital Design Collective has made freely available tools to implement to measure the Ecoindex of a project as well as a list of good practices. There is also a tool (CLI), offering an easy way to analyze websites with Ecoindex from your local computer, offline, using multithreading.
- https://ecograder.com - Ecograder renders an improvement report based on user experience, page weight and hosting. The tool, developed by The Green Web Foundation is open source.
- http://mobileenerlytics.com - Measure the energy efficiency of a mobile app or website with the App Scan tool
#2 Example of an estimate
Using Ecograder, we estimate that for each visit to the Amazon.com page, it emits 1.377 g of carbon dioxide equivalent (CO2e). Knowing that in the month of October 2022 there were 4'139'334'639 visits, with an average rate of pages visited of 4.33 per user. We can therefore estimate that 18 thousand tons of CO2 were released in October by the Amazon homepage. The equivalent of 18 flights between Paris and New York.
#3 Measuring the performance of your website
- https://unused-css.com - When a web page is visited, the entire CSS is loaded, however, not all of it is used, so this delta (Loaded - Used = Delta) is loaded in vain. Unused-css allows to list the CSS files loaded per page, and the percentage used for each of these files.
- https://www.giftofspeed.com/gzip-test/ - As seen above, the volume of pages is constantly increasing. The mod_deflate module is an apache module that compresses the server output before sending it to the client over the network, to limit the bandwidth used. Gift of speed allows to know the percentage that this module compresses, or could compress.
- WebPageTest - The most common tools to measure performance are Google's PageSpeed Insights and Web.dev. Web Page Test is also a more complete performance measurement tool. For a minor, simpler test, there is Pingdom Tools.
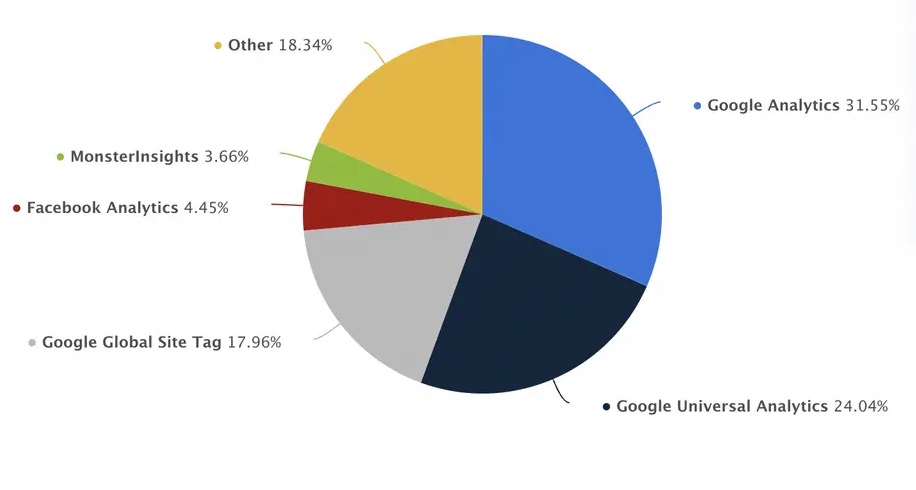
#4 Web analytics tools
It is impossible to do without an analytics tool for your website. The most (widely) used is Google Analytics.
It is important to note that environmental friendliness depends on many factors, such as the amount of energy needed to maintain the user's servers, the energy used to develop and maintain the software, and the amount of energy used to access the service. It is therefore difficult to say whether Google Analytics is "eco-friendly" or not, depending on the specific circumstances of each use. However, more ethical alternatives are available such as :
- Matomo Analytics, which in addition to being a less energy-intensive tool, is an equally powerful web analytics platform that gives full ownership of the data, and is GDPR compliant.
- Plausible, a lightweight, open source web analytics tool. No cookies and fully compliant with GDPR, CCPA and PECR. Made and hosted in the EU, powered by European-owned cloud infrastructure.
Conclusion
Our increasing use of the Internet is having a significant impact on the environment. Data centers and electronic devices are consuming more and more energy, and greenhouse gas emissions related to the manufacturing and transportation of these products are increasing. It is important to make users aware of these issues and encourage them to use technology responsibly.
The figures above are intended to raise awareness of the ecological impact of digital technology. The importance of measurement lies in the fact that it allows us to become aware of the level of our consumption, whether as a user or as a website owner.
However, at our level simple solutions can be put in place to limit our consumption.