AI and vectors, when your data make sense
Can Chat-GPT, Bard, Mistral or any other artificial intelligence understand the meaning behind every word? To answer this question, let's turn the spotlight on vectors and vector databases, which enable artificial intelligence to give life to models capable of interpreting and understanding the subtleties of the information provided to it. Discover how artificial intelligence models transform text into powerful vectors, opening the door to semantic analysis possibilities.

Before we dive into the subject, if you're not familiar with the terms token, model and LLM, I strongly advise you to consult our article, which is accessible to all: Understanding Artificial Intelligence models.
To answer the question "How can a machine extract context from a text?", we first need to define what semantics is, what a vector is, and then what a vector database is.
What is semantics?
In the context of AI (artificial intelligence), semantics concerns the way in which LLM models interpret and "understand" information. If we take the term "letter" as an example, it can refer either to a letter, or to the character of a piece of writing. Semantics aims to clarify these subtleties so that the model can process the data efficiently.
What is a vector?
As Cloudflare explains: "In mathematics, a vector is a combination of numbers that defines a point in a dimensional space. In more practical language, a vector is a list of numbers, for example 0.15, 1.1, 1.40, -0.2, ..., 0.14, -0.13. Each number indicates the position of the object along a given dimension". A vector database stores information in this form, among others.
A vector database is an organized set of data represented in tabular form (multidimensional vectors), used to store and manipulate information from images, text, sound or other digital data, providing a structure for data analysis.
| TV show | Genre | Year debuted | Episode length | Season (through 2023) | Episodes (through 2023) |
|---|---|---|---|---|---|
| Seinfeld | Sitcom | 1989 | 22-24 | 9 | 180 |
| Wednesday | Horror | 2022 | 46-57 | 1 | 8 |
In the table above, we see 2 series, Seinfeld and Wednesday, we could convert them to vectors this way:
- Seinfeld: ['Sitcom', 1989, 22-24, 9, 180]
- Wednesday: ['Horror', 2022, 46-57, 1, 8]
Each column would be expressed as a dimension, creating two 5-dimensional vectors.
However, the Genre column, which contains categorical data such as 'Sitcom' or 'Horror', cannot be directly represented by a simple number in a numerical vector. Yet it must be a numerical value, but there is no calibration possible with series genres. In other words, genres cannot be ordered (linearly).
To integrate this information into a vector that can be processed by an AI model, these categories need to be converted into numerical data. Several techniques are possible. The simplest is to transform the Gender column into several binary columns, where each column corresponds to a possible gender category, with a value of 1 to indicate the presence of that gender and 0 for its absence. This method is called One-Hot Encoding.
Once converted, vectors take on the following form:
- Seinfeld: [1989, 22-24, 9, 180, 1, 0, 0, 0, 0], where 1 is for Sitcom and 0 for other genres.
- Wednesday: [2022, 46-57, 1, 8, 0, 1, 0, 0, 0], where 1 is for Horror and 0 for other genres.
This method maintains the integrity of the original information while making it usable for complex analyses, such as similarity comparison, classification, or recommendation based on user preferences.
Embedding: the transformation of data
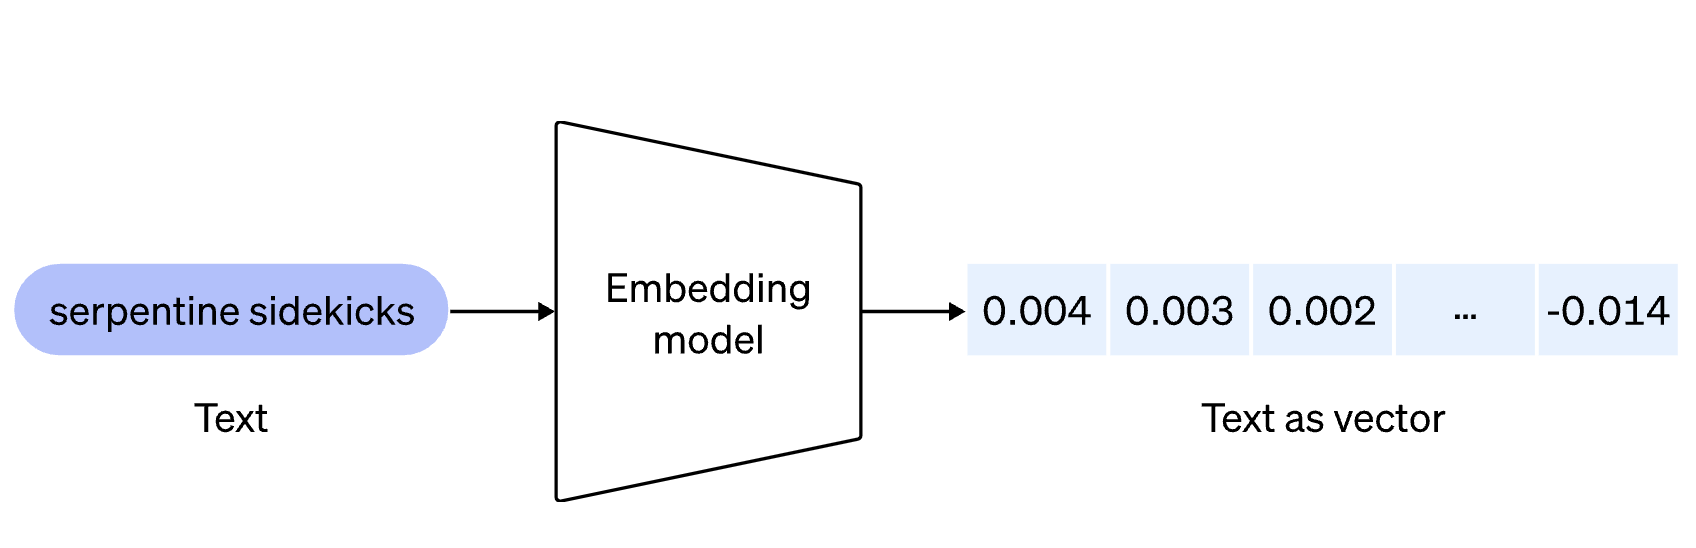
Embedding is a method for transforming data from images, text, sound, user data or any other type of information into digital vectors. It's like translating human language into a language that machines can interpret, thus capturing the semantic or contextual nuances of the processed elements.
Why are the vectors returned by the embedding model comma-delimited numbers... sometimes positive, sometimes negative, with no meaning, whereas in our example with the series, the numbers are simply positive integers with meaning for each element? The models work with data that are weighted and normalized to capture complex relationships and subtle differences in the data.
The models work with data that are weighted and normalized to capture complex relationships and subtle differences in the data. In addition, floating-point vectors enable greater precision in these calculations, and negative values can represent the opposition of a certain dimension to a reference point or average.
Embedding makes it possible to convert information into numerical formats that can be interpreted by machines, offering extensive possibilities for data analysis and use. Taking the word "apple" as an example, embedding will convert it into a series of numbers that capture the semantic nuances of the term. It's this series of numbers that we call a vector. Vectors can then be used for similarity searches, contextual analysis, generative AI and more.
Semantically similar words will have vectors close to each other in vector space.
To take the example of the word "letter", in the context of a document, it will not have the same vector as the word "letter", which represents a writing character. Or the words apple (fruit), apple (brand), banana and Google, will be just as close in a vector space, because they have a meaning that connects them.
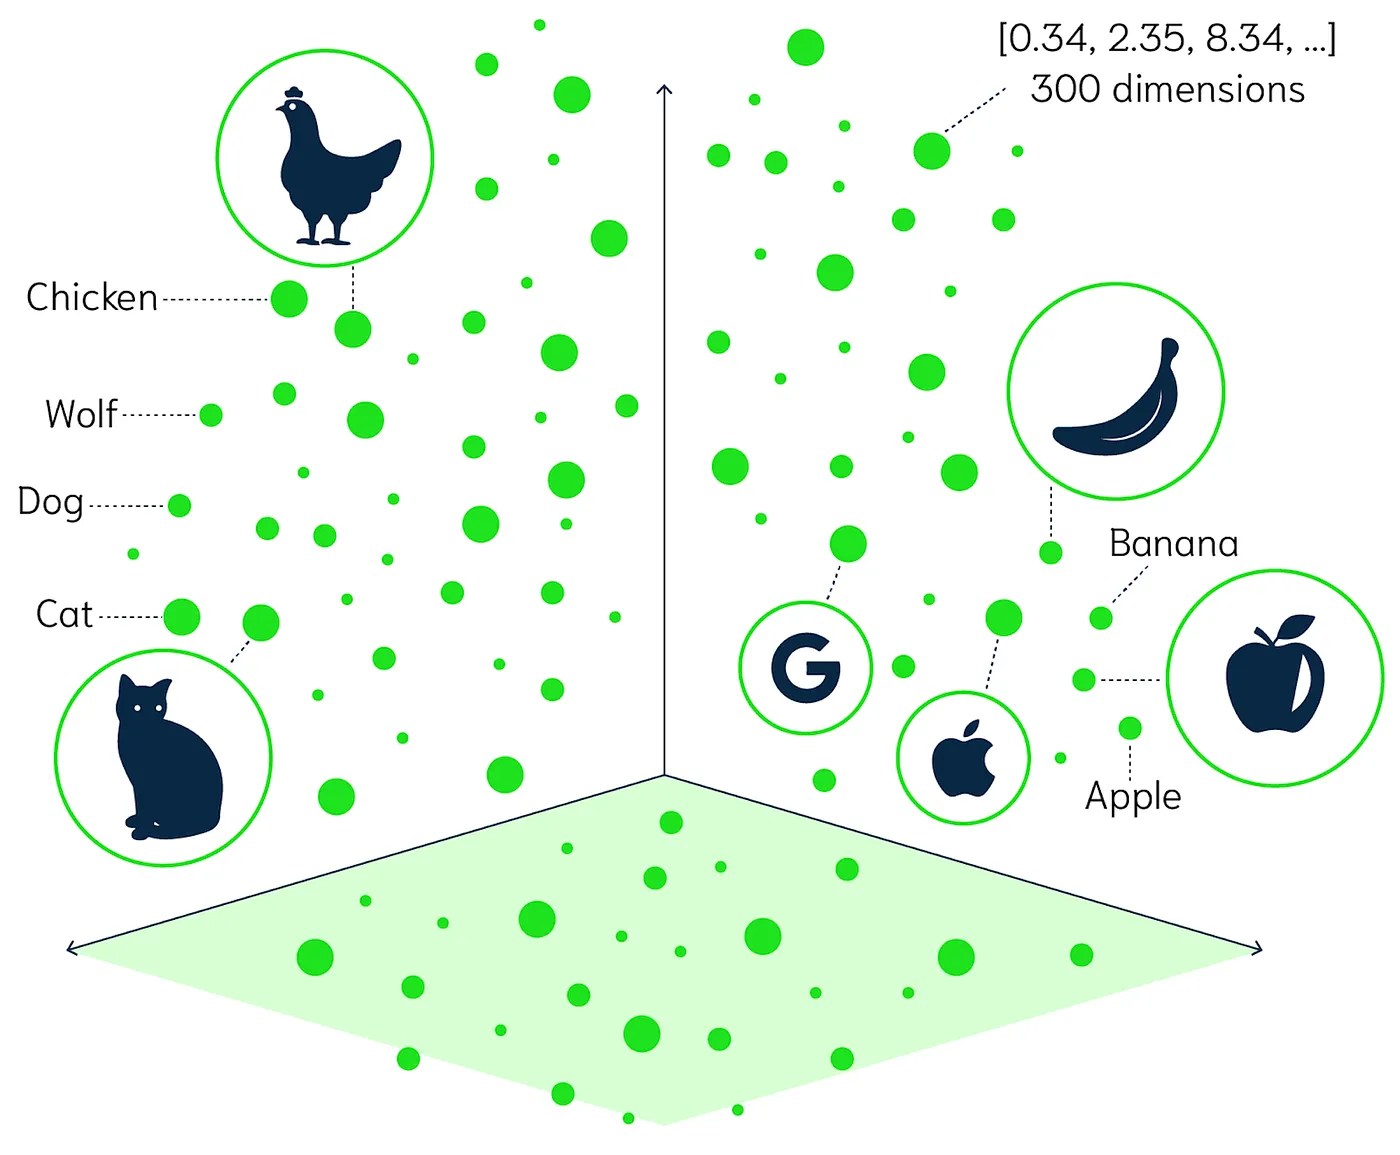
The illustration above shows vectors on a 3-dimensional plane. However, these vectors can span several hundred distinct dimensions. Yes, because as we've seen, each column in the table represents a dimension. Each word, token or phrase can be converted into a vector of several hundred dimensions. The number of dimensions depends on the embedding model chosen.
These vectors are essentially points in a multidimensional space, where each dimension acts as a weight measuring importance, as discussed in our previous article on LLM models. For example, in the expression "Atipik will save the world" = [0.34, -1.02, 0.34, 1.2, ..., 1.14, -0.03], each number in the vector represents a semantic aspect in several dimensions.
To explain in (almost) simple terms: each vector captures different features of the meaning of a word or phrase. These vectors coexist in a space with many dimensions, where each dimension contributes to defining the meaning and usage of words or phrases in a comprehensible way.
Vector databases are (not) magic.
Now that we've got vectors, we can use them with each other! Optimized databases exist for operations such as similarity search, such as Pinecone, Weaviate, Zilliz, Milvus, Qdrant..
Summary of a search through a vector database.
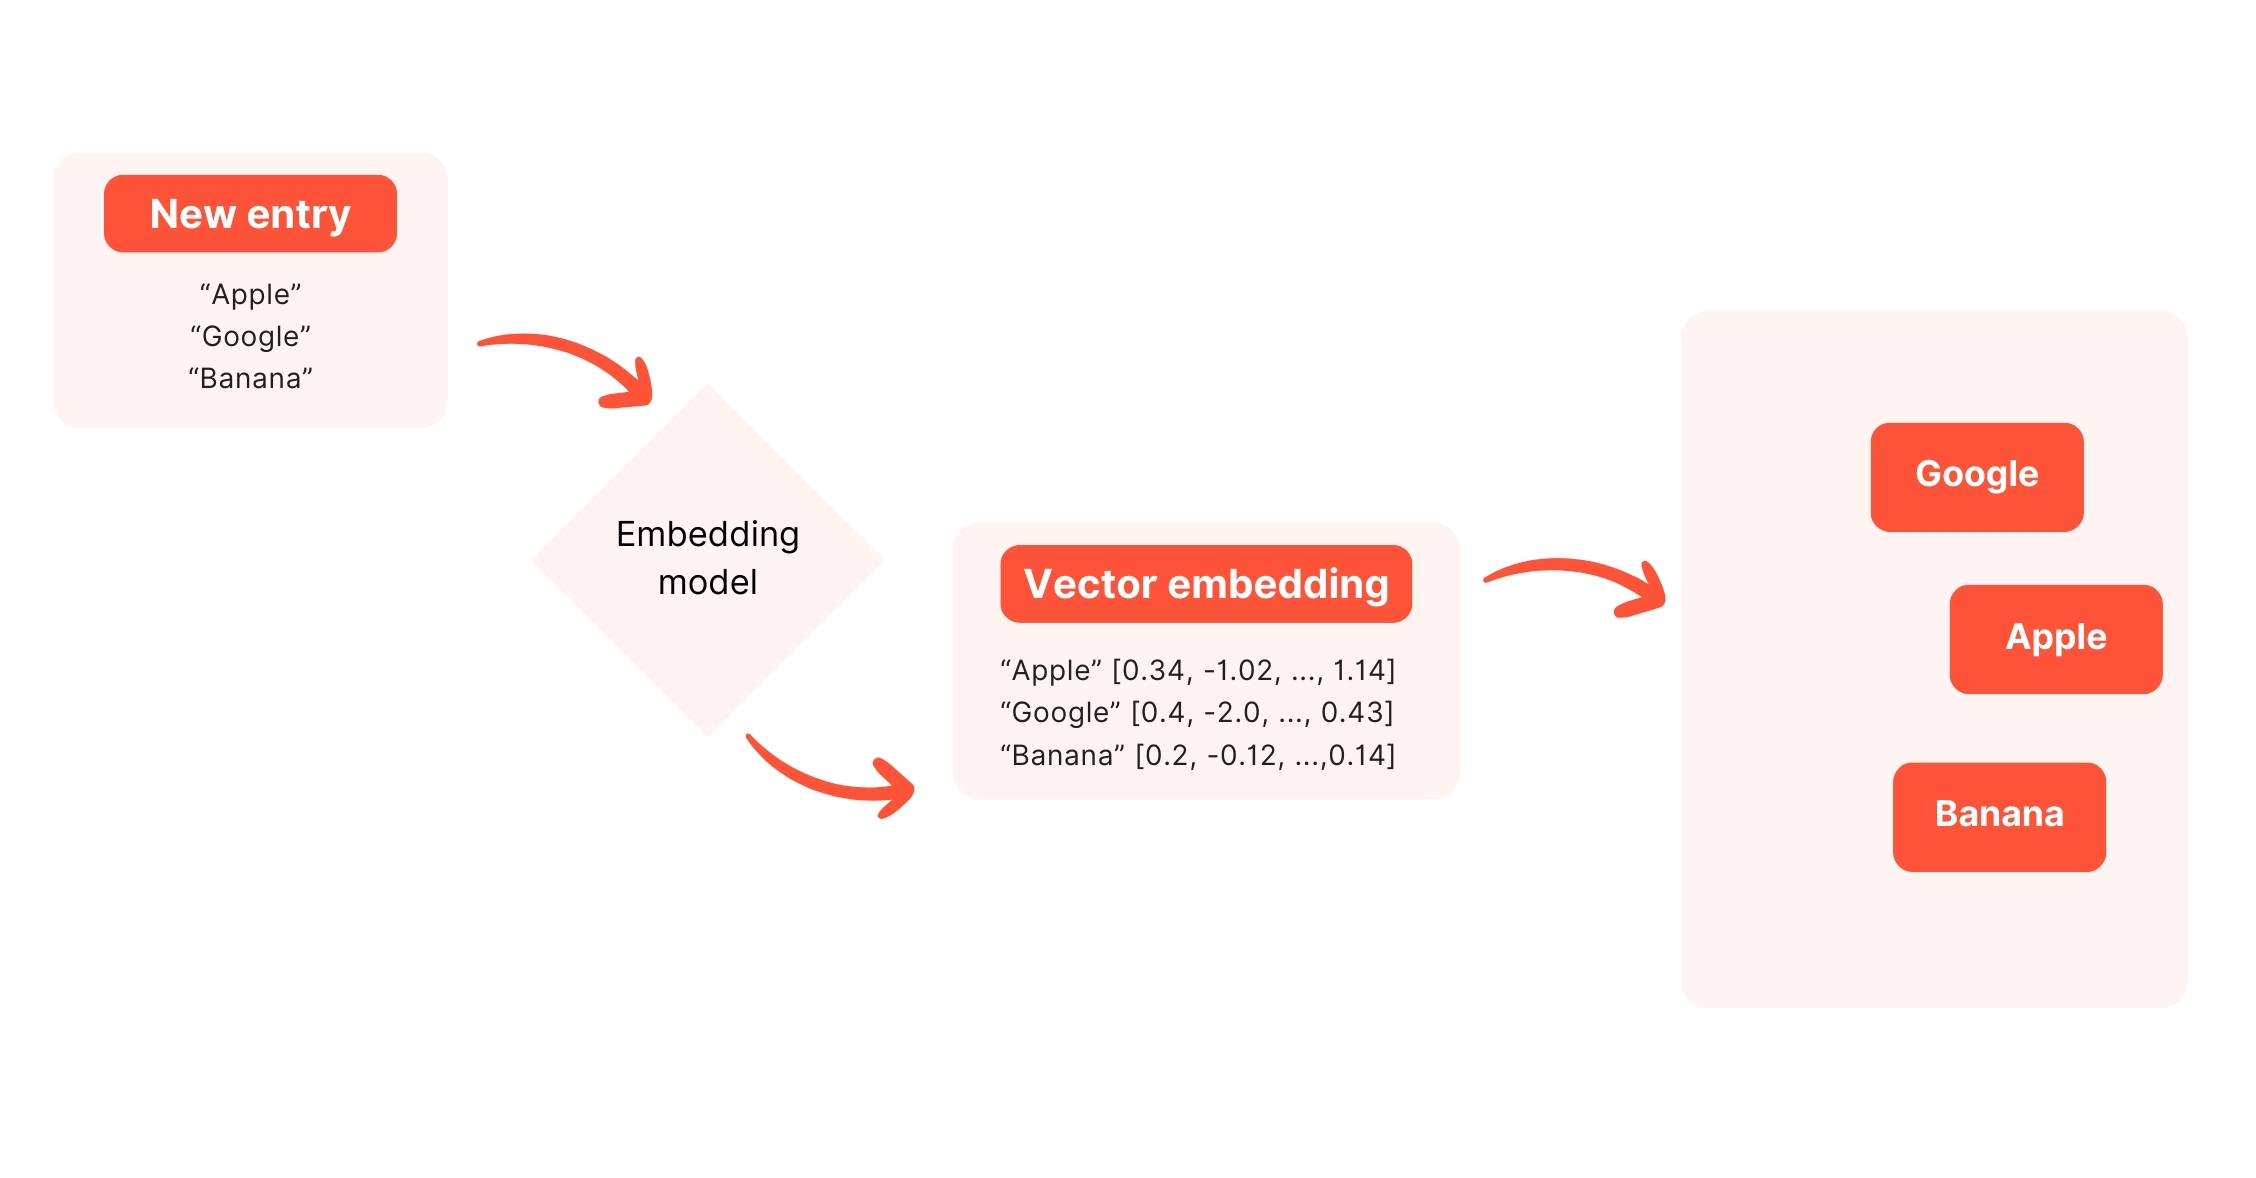
In this diagram, you can see how the data is added to the database.
The process involves transforming the data (Apple, Banana, Google) into vectors using an embedding model (Embedding Model) such as the french_semantic seen above.
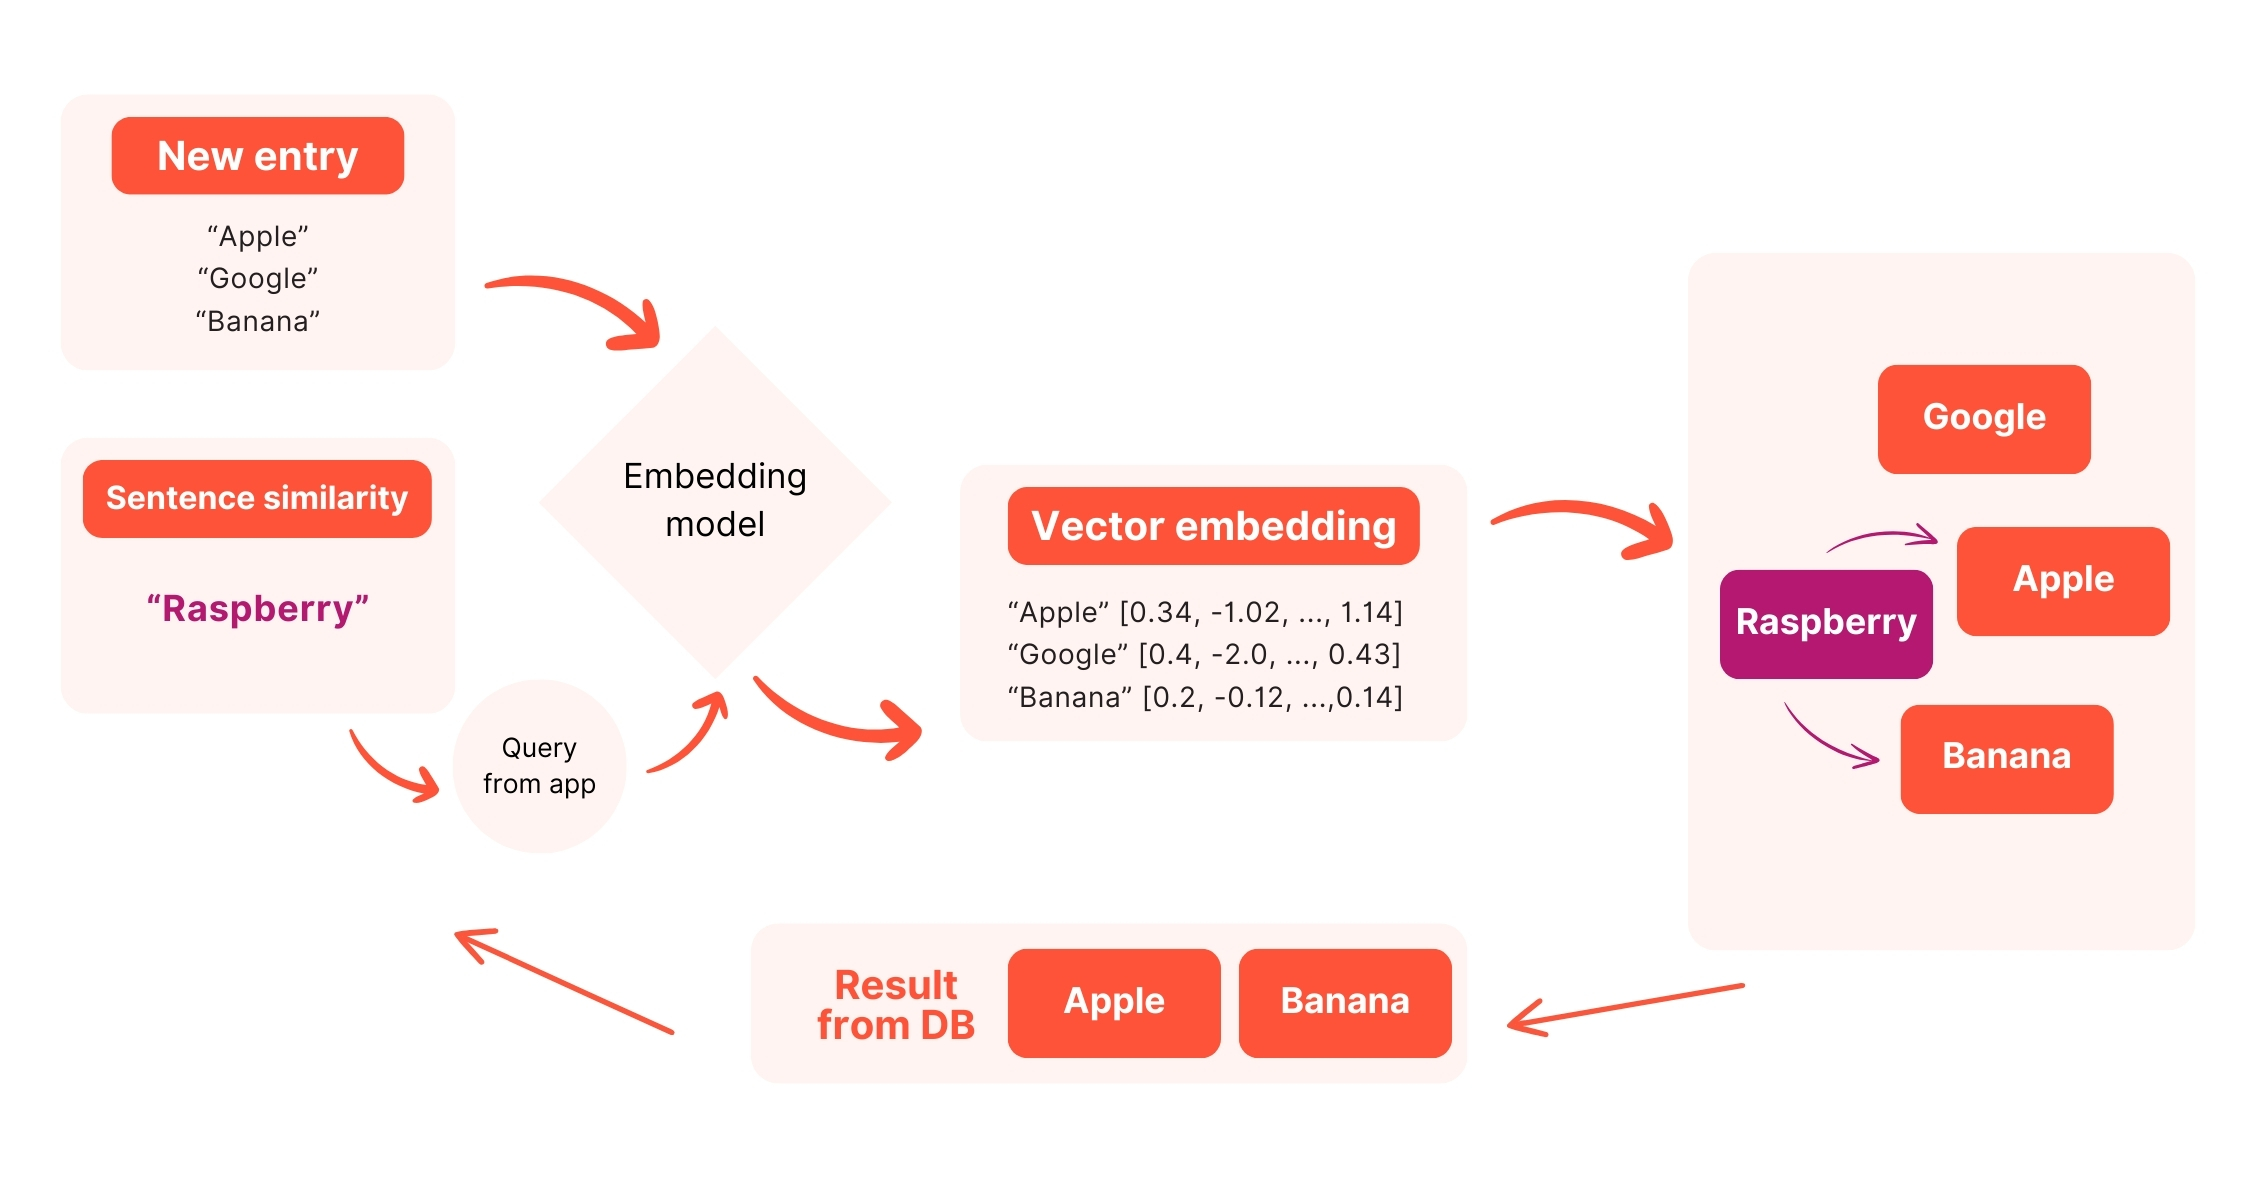
In this diagram we can see la search (Query from App) from an application. The process also involves the transformation of data (Rasberry) into vectors using an embedding model. Previously inserted vectors are exploited in a vector database, through a similarity search. The corresponding data (those with the most similarities) are identified via the vectors and returned to the application (Query result).
Putting into practice a search through a vector database
As seen above, the data (word, token, phrase) are converted into vectors. They are then added to the database along with their respective text. For example:
{
	'text': 'He beat the electrician to the ground',
	'vector': [0.34, -1.02, 0.34, 1.2, ..., 1.14, -0.03]
}
Indexing: Vectors added to the database are indexed in the database. Indexing is optimization, to allow fast searches. Thanks to the vector index, we can efficiently query several vectors similar to the target vector.
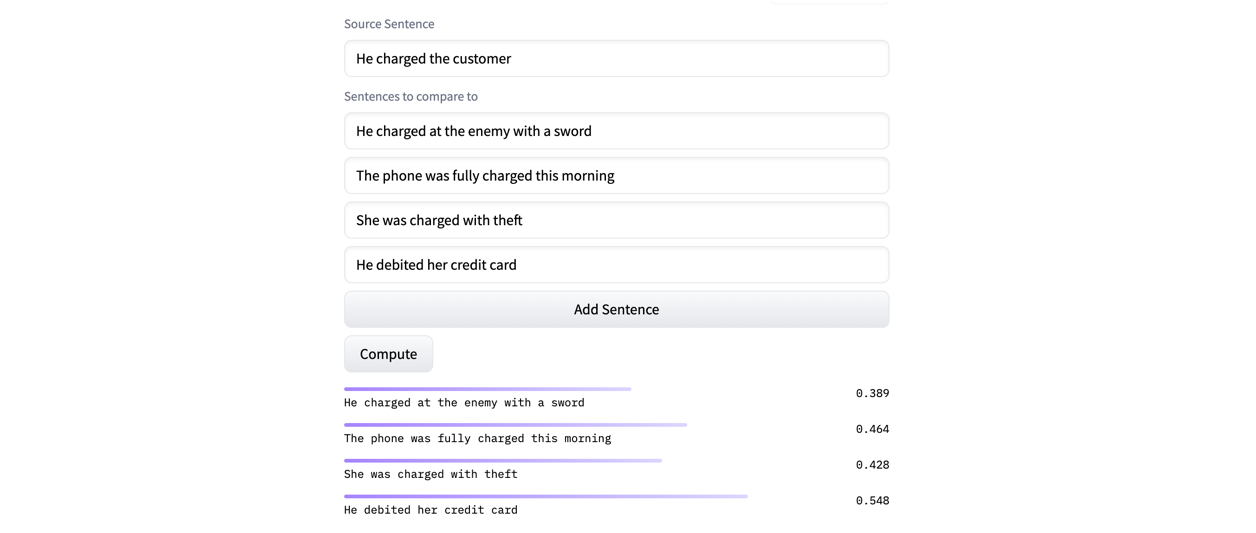
Search: For our example, if we're looking for texts that have the most similarities to the sentence "He charged the customer". We convert the target sentence "He charged the customer" into a vector, then create a query to the database. The database then performs a search for vectors most similar to the target vector. The results are accompanied by their text, as well as the semantic similarity score. We can see that even without the word "charged", the sentence "He debited her credit card" has a better score, as both sentences have similar semantics. Magic? Not really. Similarity is often measured using mathematical distances, such as Euclidean distance or cosine similarity. There are thousands of other models with their test interface on hugging face.
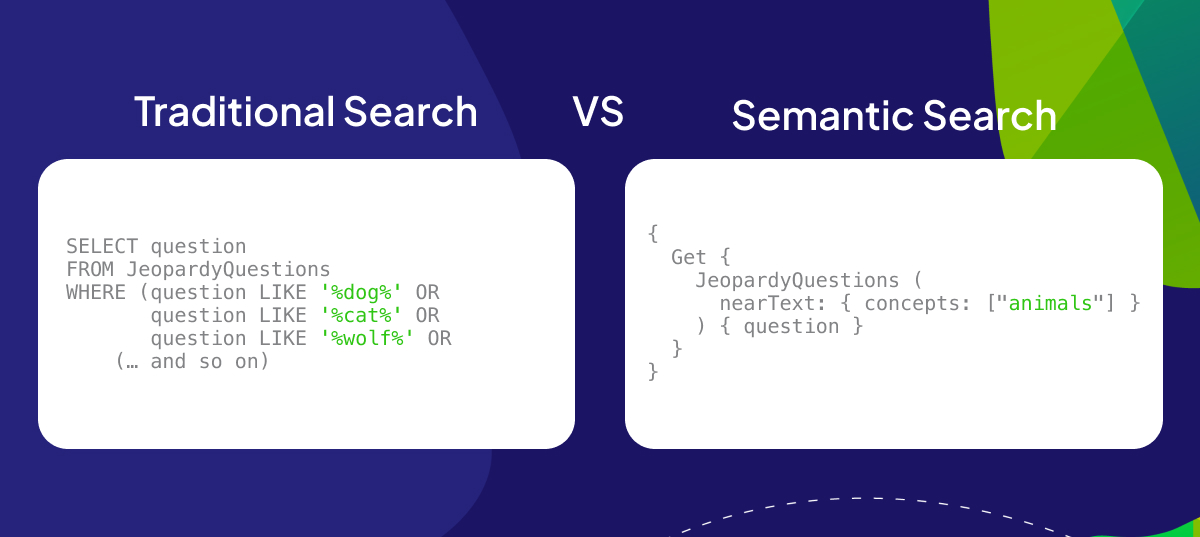
Why not use a database like MySQL?
The main reasons why MySQL can't replace these specialized databases are:
- Data structure: MySQL is designed around tables with fixed relationships, whereas vector databases manage data in the form of vectors, often in multidimensional space.
- Similarity search: Databases like Pinecone and Milvus offer similarity search capabilities that enable you to find vectors close to a query vector, which is essential for applications like recommendation systems or fraud detection.
- Scalability and performance: these systems are built to handle very large data sets and offer fast response times for complex queries, which is not the case with MySQL.
- Indexing: these technologies use advanced indexing techniques adapted to searches in high-dimensional spaces, which is not the case with MySQL.
K-Means: grouping by semantics. Practical uses for all
Let's say we have a large number of objects, phrases, images, sounds or whatever, and we'd like to group them. For example: I've just come back from vacation, and I've got 1,000 e-mails to deal with. I'd like to make 5 groups, sorted by type, so that I can manage them by priority. This is where K-Means comes in.
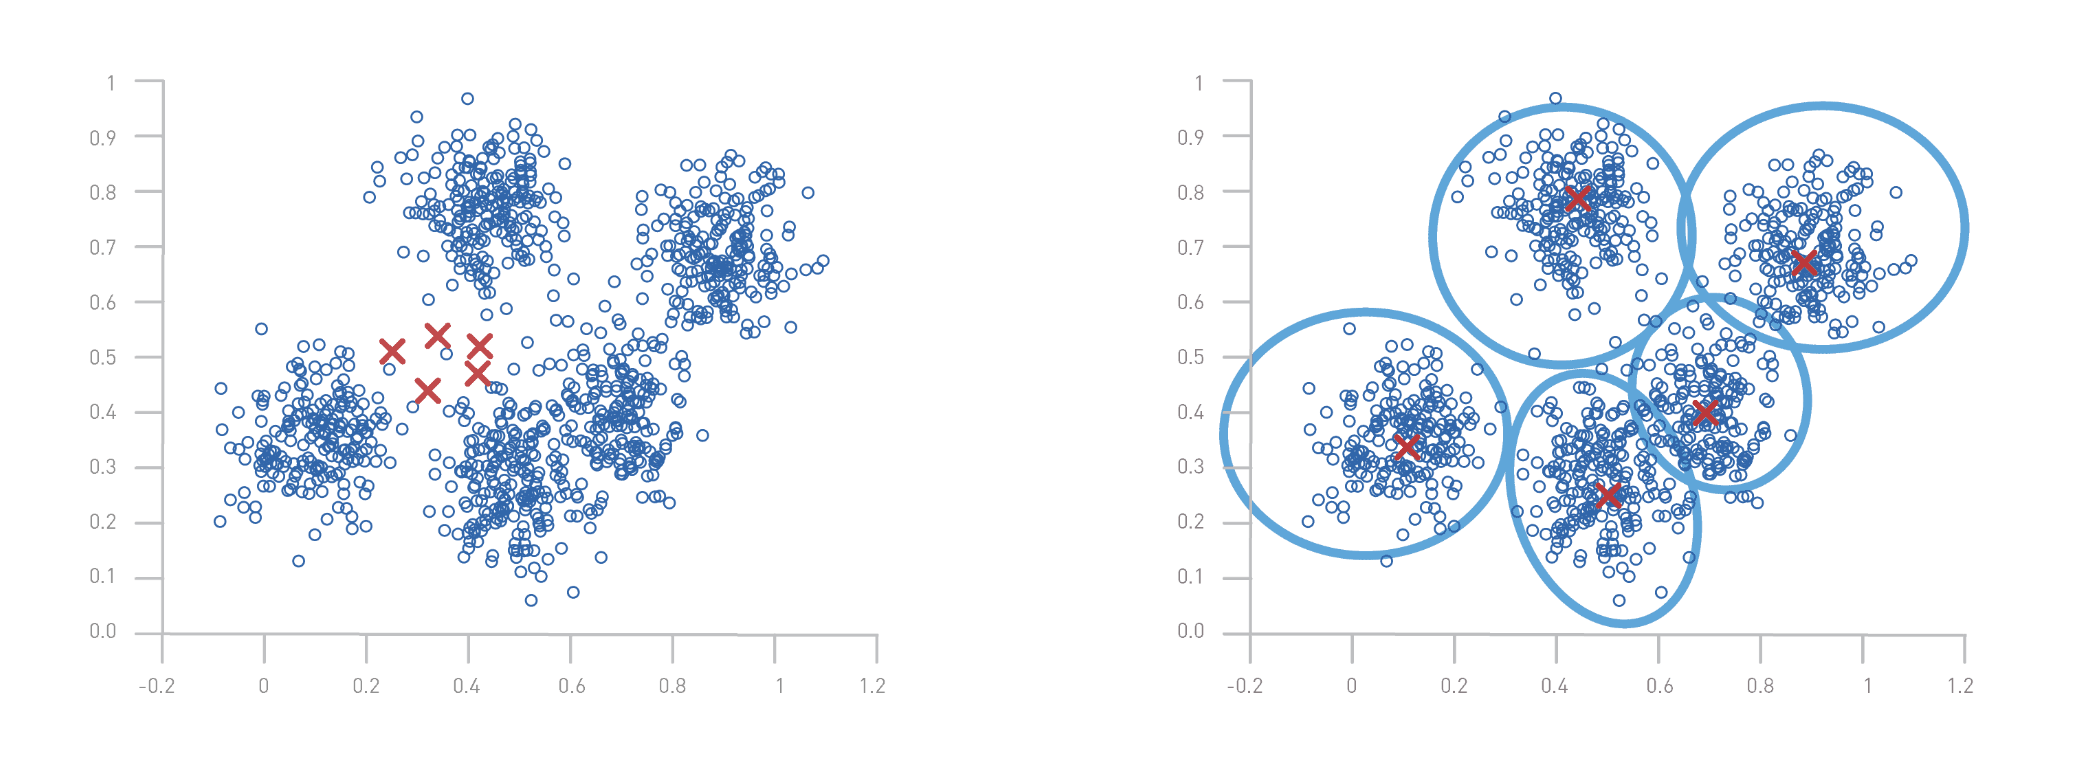
How does the K-Means algorithm work?
- Choosing the number of groups: The first step is to define the number of groups, or "clusters", you wish to create. In our example, we've chosen 5 clusters.
- Initialization of centroids: K-Means begins by randomly initializing 5 points, called centroids, which represent the center of each cluster.
- Assign data to centroids: Each mail (or object) is then assigned to the nearest centroid, according to the distance between the object and each centroid.
- Update centroids: Once all objects have been assigned, centroid positions are recalculated. This is done by taking the average of all objects assigned to each centroid.
- Repeat until stabilized: Steps 3 and 4 are repeated until the centroids no longer change position significantly, meaning that the groups are stable.
Optimized e-mail sorting
This system simplifies and improves e-mail management in two key steps, enabling fast and relevant sorting based on content:
- Attribute Extraction: Each e-mail is analyzed to extract key characteristics such as keywords and message length, converted into numerical vectors for accurate analysis.
- Automatic classification: Using the K-Means algorithm, e-mails are grouped according to similar content. In this way, messages on common subjects such as meetings are classified together, facilitating efficient organization and improved time management.
Other use cases:
- Perfumery: fragrance classification
Situation: A perfume company wants to classify thousands of fragrances to develop new perfumes or recommend products to customers. Application of K-Means : Fragrance descriptions (floral, woody, spicy, etc.) are converted into vectors. K-Means is used to group fragrances according to their similar olfactory profiles, facilitating the creation of collections or personalized recommendations to customers. - Real estate: segmenting the real estate market
Situation: A real estate agency wants to segment listed properties to better target potential buyers. Application of K-Means : Property characteristics (location, size, price, etc.) are analyzed. K-Means allows properties to be grouped into homogeneous categories, helping agents to target specific market segments with tailored marketing strategies. - Beer keg deposit management
Situation: A brewery wishes to optimize the management of its beer kegs to ensure efficient supply to different establishments. Application of K-Means : Data is collected on keg usage and demand at various locations. K-Means can be used to identify groups of establishments with similar needs in terms of volume and frequency of delivery, facilitating logistical planning and distribution.
Conclusion
Artificial intelligence represents a revolutionary advance and continues to develop all the time. In my opinion, we are still in the infancy of this innovative technology, which could, when combined with other existing technologies, trigger a series of revolutionary transformations in many different fields. What's more, the future of AI must be shaped by a synergy between technological innovation and ethical principles, guaranteeing progress that benefits society as a whole. Translated with